The percentage of immigrants that are represented by an attorney in removal proceedings varies substantially from city to city. Regardless of location, most immigrants that are ordered removed are not represented.
COURTS WITH HIGHEST PERCENTAGE OF REPRESENTED RESPONDENTS
| COURT | % REPRESENTED |
|---|---|
| Hawaii | 56% |
| California | 49% |
| New York | 44% |
| Virginia | 43% |
| Massachusetts | 41% |
| Nebraska | 41% |
| Pennsylvania | 39% |
| Maryland | 38% |
| Minnesota | 37% |
| Nevada | 35% |
| Washington | 35% |
COURTS WITH LOWEST PERCENTAGE OF REPRESENTED RESPONDENTS
| COURT | % REPRESENTED |
|---|---|
| US TOTAL | 30% |
| UTAH | 23% |
| Oregon | 22% |
| Florida | 21% |
| Tennessee | 19% |
| Connecticut | 19% |
| Texas | 18% |
| Georgia | 18% |
| North Carolina | 17% |
| New Mexico | 14% |
| Colorado | 14% |
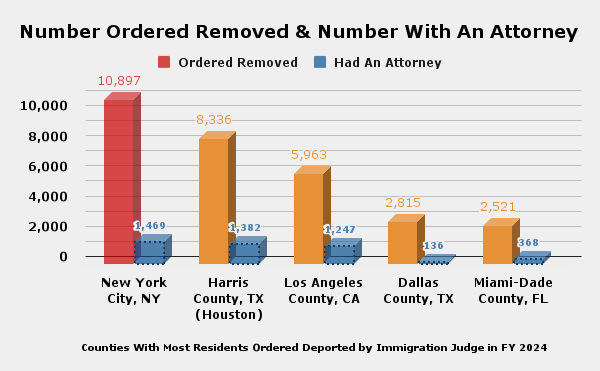
Immigrants Ordered Removed & Percent With Attorney
Immigration Courts with the most removal orders issued October 2023 – March 2024
| IMMIGRATION COURT | RANK | ORDERED REMOVED | # WITH ATTORNEY | % WITH ATTORNEY |
|---|---|---|---|---|
| New York City, NY | 1 | 10,897 | 1,469 | 13% |
| Harris County, TX (Houston) | 2 | 8,336 | 1,382 | 17% |
| Los Angeles County, CA | 3 | 5963 | 1247 | 21% |
| Dallas County, TX | 4 | 2815 | 136 | 5% |
| Miami-Dade County, FL | 5 | 2521 | 368 | 15% |
| Montgomery County, TX (Conroe)* | 6 | 1,968 | 388 | 20% |
| San Bernardino County, CA | 7 | 1,703 | 383 | 22% |
| Travis County, TX (Austin) | 8 | 1,664 | 123 | 7% |
| Orange County, CA (Santa Ana) | 9 | 1,576 | 412 | 26% |
| Cook County, IL (Chicago) | 10 | 1,527 | 179 | 12% |
Data from TRAC Report
* Jurisdiction of a large ICE contract detention facility owned and operated by the GEO Group (a for-profit company which runs private prisons).

The Difference Having a Lawyer Makes
The percentage of immigrants in removal proceedings that are represented by counsel appears to hover between 22% – 30% with 2021 being an outlier in which 52% of immigrants ordered removed were not represented. See the chart below based on TRAC Immigration Court Data-Full TRAC Report Here.
Percent of Immigrants With Attorneys Ordered Removed in Immigration Court
FY 2014- FY 2024
| Fiscal Year | Ordered Removed | Had an Attorney | Percent with Attorney |
|---|---|---|---|
| 2014 | 78,538 | 17,063 | 22% |
| 2015 | 81,767 | 17,424 | 21% |
| 2016 | 79,720 | 19,567 | 25% |
| 2017 | 101,469 | 27,341 | 27% |
| 2018 | 120,343 | 40,428 | 34% |
| 2019 | 187,039 | 58,971 | 32% |
| 2020 | 164,430 | 47,985 | 29% |
| 2021 | 38,021 | 19,910 | 52% |
| 2022 | 111,830 | 36,038 | 32% |
| 2023 | 236,726 | 47,816 | 20% |