
U.S. immigration judges issued a staggering 136,623 deportation orders during the initial six months of Fiscal Year 2024, according to an analysis by the Transactional Records Access Clearinghouse (TRAC), a nonpartisan, nonprofit data research center affiliated with the Newhouse School of Public Communications and the Whitman School of Management at Syracuse University.
This is a significant surge in removal orders compared to the previous peak in removals observed in FY 2019 under the Donald Trump administration and the peak in FY2011 – FY2012 under the Obama administration. The current pace of removal orders have soared by 50 percent. This surge coincides with the expansion of immigration judges during the current administration.
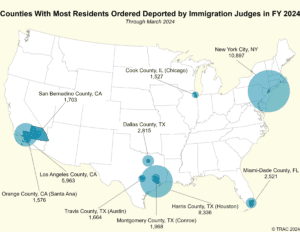
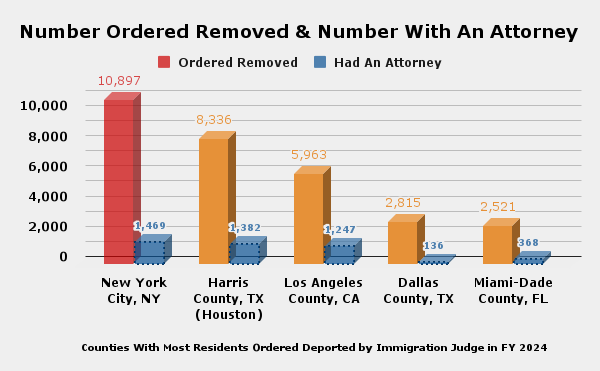
New York City emerged as the epicenter of deportations, with just under 11,000 removal orders issued to immigrants residing there. Following closely behind was Harris County, TN, which witnessed more than 8,000 removal orders, and Los Angeles County, CA, with nearly 6,000 removal orders. Despite the prominence of those three top regions, Dallas County, TA, and Miami-Dade County, FL, also witnessed substantial deportation figures. The disparity becomes evident when looking at Miami-Dade County, which has only one-fourth of the removal orders of New York City and less than half of Los Angeles.
Analysts also found that as immigration judges accelerate the issuance of removal orders, fewer immigrants ordered for removal manage to secure legal representation to advocate their cases. ATRAC examination of year-by-year trends over the past decade reveals a nuanced trajectory according to an article in the Amsterdam News.
Between 2016 and 2019, the total number of removal decisions saw a modest increase, but there were notable improvements in representation rates. However, the onset of partial government COVID-19 shutdowns precipitated a sharp decline in decisions, coinciding with a surprising uptick in the likelihood of finding legal representation. This anomaly probably stemmed from the decreased demand for immigration attorneys due to the reduced number of court hearings, subsequently alleviating supply constraints, TRAC found.

Since Fiscal Year (FY) 2021, the rate of legal representation for immigrants facing removal proceedings has sharply declined. Last year, representation rates dropped to just 20 percent. In FY 2024, this decline continued, with only 15 percent of immigrants ordered for removal able to secure legal representation. Interestingly, this contrasts significantly with the current representation rate of 30 percent for all immigrants in the court’s backlog.
The implications are clear: Immigrants without legal representation face significantly higher odds of being ordered for removal. This underscores the urgency of addressing the challenges encountered by immigrants navigating the legal intricacies of deportation proceedings in the United States.
Ranking of Places With the Most Residents Ordered Removed in Immigration Court
Whether Immigrant was Represented when Removal Ordered
Proceedings During FY 2024 (October 2023 – March 2024)
| Rank | Ordered Removed | Had An Attorney | Percent with Attorney | |
| New York City, NY | 1 | 10,897 | 1,469 | 13% |
| Harris County, TX (Houston) | 2 | 8,336 | 1,382 | 17% |
| Los Angeles County, CA | 3 | 5963 | 1247 | 21% |
| Dallas County, TX | 4 | 2815 | 136 | 5% |
| Miami-Dade County, FL | 5 | 2521 | 368 | 15% |