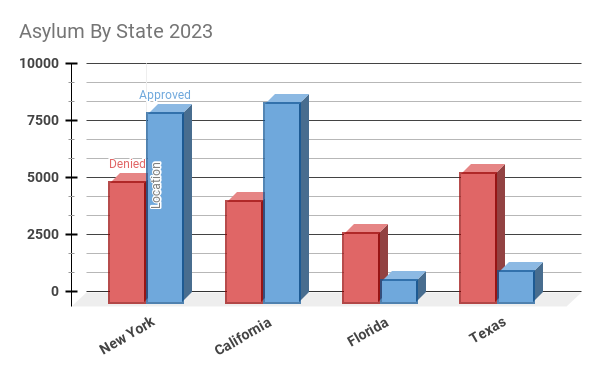
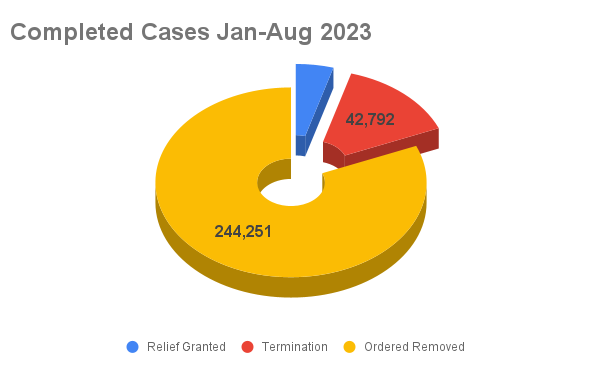
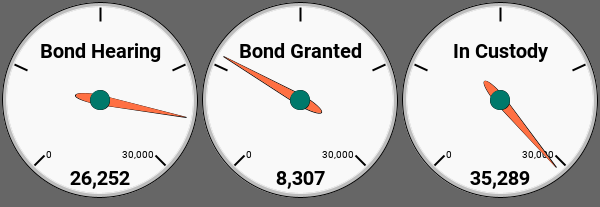
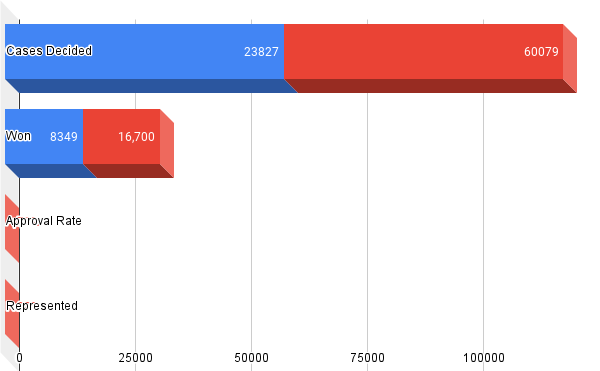
Total new cases January – August 2023: 1,488,110 RED: Denied BLUE: Approved Jan-Aug 2023 Immigration Bond Statistics 2020 vs. 2021 Asylum Statistics Blue: FY 2021 Red: FY 2020 Related: Immigration Detention Statutory Framework Four provisions of the INA primarily shape the immigration detention framework: INA § 236(a) generally authorizes the detention... Asylum Interview Interpreter Requirements Updated USCIS announced to policies that will be taking effect on September 13, 2023. Anyone attending an asylum interview after September... PAYING A USCIS FILING FEE BY CREDIT CARD How to Pay USCIS Filing Fee With a Credit Card... USCIS Implements “a Rigorous, Holistic, and Comprehensive Good Moral Character Standard” for Naturalization On August 15, 2025, the Department of Homeland Security published PM-602-0188, a Policy Memorandum with the subject, “Restoring a Rigorous,... Tags:courtnews 1 thought on “January – August 2023 Immigration Court Statistics” binance December 3, 2024 at 3:47 pm Reply Your point of view caught my eye and was very interesting. Thanks. I have a question for you. Leave a Reply Cancel replyYour email address will not be published. Required fields are marked *Name * Email * Website Comment * Save my name, email, and website in this browser for the next time I comment. Are you human? Please solve: previousMandatory DetentionnextThe Convention Against Torture
binance December 3, 2024 at 3:47 pm Reply Your point of view caught my eye and was very interesting. Thanks. I have a question for you.
Your point of view caught my eye and was very interesting. Thanks. I have a question for you.